 Case Study


Banking and Finance
Their existing clients had well appreciated their expertise, and they had wished for the expansion of their business through an international financial portal development. Here is the briefing on how we helped our clients achieve what they wished for.

The client didn’t want anything from the previous stack. He wanted to have a portal that is fresh and away from any prior references.

The client also didn’t want to hire multiple agencies for diverse processes. He wanted to lease off work to an agency that could do everything by itself. It is good that we have all the process experts under our roof.

As we are talking about finances, the company wished to keep a close check on all the data and changes happening in the numbers. Hence they needed an application that would come with efficient data analytics, which can help them in planning the further move.
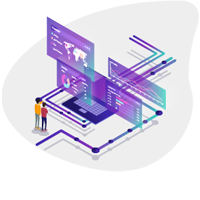
The technical data is full of jargon and is many times not understood by the layman. Hence, the display by graphical representations would ass the charm to the profile.

The client didn’t want just one kind of visualization. He wanted his portal to be embedded with bar graphs, pie charts, histograms, maps, etc. He also wanted to use the color variations in the visuals.

The client wanted to integrate over 10,000 servers with the portal. Hence, the bearability of the portal had to be set vast; this was a large scale operation which should be able to bear more than enough burden.

The client wanted everything to be developed from scratch and didn’t want anything to be chosen from the previously developed program. This left no reference, and everything had to be developed fresh without any inspiration or reference.

The Client did not just want the visuals to be attractive; he wanted them to be interactive as well. The client wanted to add the functions on the sections of the visuals so that the user can get more information about the same topic.

To ease up each work and search, the client wanted to add the sorting filter as well so that the user did not have to employ the efforts to find something. He needed the filters, which could help in sorting the functions.

In the financial world, the situations keep on changing. Hence, the client wanted to develop such a system where the data could be customized from his end only. He needed a customizable database that could be changed according to the market needs.
Our team of experts delivered an efficient Financial Portal, which can pull out a large amount of financial data of the customers and visualize it. The visualization was in the form of maps, images, and diagrams.


The portal we so provided came out with an opportunity to receive a well organized and visualized summary of the market. The solution has complex logistics of the business, allowing analysis of the content from the customer’s CMS and user interface to enable and create own data canvas.
The team of ours completed the targets and met the expectations of the client so well that we have become the agent of yet another success story, building a lifelong corporate relation.


 +1 415 800 4089
 info@ravtsack.com


